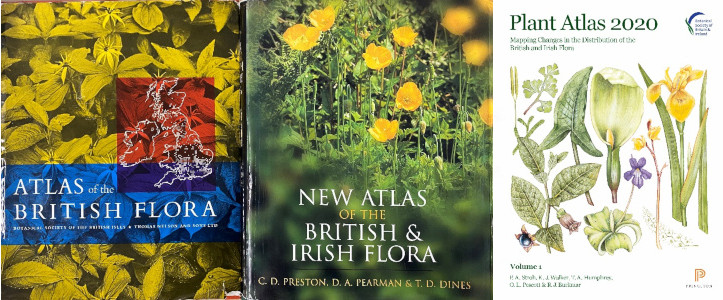
The Botanical Society of Britain and Ireland (BSBI) has published three national distribution atlases based on nationwide surveys of flowering plants and ferns undertaken between 1930–1969, 1987–1999 and most recently 2000–2019. This third national survey – Plant Atlas 2020 – involved over 8,500 volunteers who visited over 99% of the 3,893 10 × 10 km squares (hectads) of the national grids used for mapping in Britain, Ireland, the Isle of Man and the Channel Islands, recording the presence of all native and non-native plants they found growing in the wild within each hectad.
Most of these 10 km squares were visited multiple times, often at different seasons to ensure that they were recorded as thoroughly as possible, even in areas remote from human population centres. During visits to these hectads, all native and non-native plants found growing in the wild were recorded, including planted trees and shrubs, but plants in gardens or as crops were excluded. In Britain, recorders spent an estimated 178,000 recording days contributing to this survey, providing a total of 26 million records. This staggering achievement highlights the crucial role that BSBI volunteers play in furthering our knowledge and understanding of the British and Irish flora. Figure 1 provides a map of the coverage achieved between 2000 and 2019 and shows that recording coverage was greatest in areas with the highest human population density (e.g. south-eastern England, English Midlands, Merseyside) although there were notable outliers in regions with very active botanists (e.g. south-eastern Ireland, Banffshire, Cornwall).
During the 2000–2019 survey, 3,495 species were recorded in Britain and Ireland, including 1,599 natives, 1,648 non-natives and 248 hybrids (of both natural and horticultural origin). Most native species were found in lowland regions, especially in south-eastern and southern England and in coastal regions of Ireland (Fig. 2). With a few exceptions, far fewer natives were recorded in the northern half of Britain and most of Ireland, especially in upland and montane regions.
The 1,648 introductions recorded comprised 161 archaeophytes (plants introduced by humans from around 4000 BC and AD 1500) and 1,487 neophytes (plants introduced by humans since AD 1500). The overall distribution of archaeophytes was similar to natives but with a much stronger association with areas dominated by arable cultivation and human population centres in the southern half of Britain and in the eastern half of Ireland, and a virtual absence from upland and montane regions (Fig. 3).
In comparison to natives and archaeophytes, neophytes had a much stronger association with urban areas, especially major cities and conurbations, but also smaller cities with a long tradition of botanical recording (e.g. Cambridge) and regions with very active recorders (e.g. south-eastern Ireland, Cornwall). The virtual absence of neophytes from most upland and montane regions throughout Britain and Ireland was striking (Fig. 4).